📅 March 2026 ⏱ 5 min read 📂 Investment Comparison
You have money to invest in mutual funds. The question is: should you invest everything at once (Lumpsum) or spread it out every month (SIP)?
This is one of the most common dilemmas for Indian investors — and the answer is not as simple as most articles suggest. It depends on market conditions, your investment horizon, and your risk appetite.
In this guide, we compare SIP vs Lumpsum across 5, 10 and 15 year horizons with actual return calculations, so you can make an informed decision for your money.
What is SIP?
SIP stands for Systematic Investment Plan. You invest a fixed amount every month — say ₹5,000 or ₹10,000 — regardless of market levels. When markets are low, you buy more units. When markets are high, you buy fewer units. Over time, this averages out your cost — a concept called Rupee Cost Averaging.
| Example: You invest ₹10,000 every month in a Nifty 50 Index Fund for 10 years. Total investment = ₹12 lakh. At 12% annual return, corpus = ₹23.23 lakh. |
What is Lumpsum Investment?
In a lumpsum investment, you invest your entire amount on a single day. If you have ₹5 lakh available, you put all ₹5 lakh into the fund at once. Your returns depend heavily on when you enter the market.
Lumpsum works best when markets are low or recovering. It works poorly when you invest at market peaks — because a subsequent crash can erode your returns for years.
| Example: You invest ₹12 lakh lumpsum in a Nifty 50 Index Fund for 10 years. At 12% annual return, corpus = ₹37.27 lakh — significantly higher than SIP because the full amount compounds for the entire 10 years. |
The Core Difference: Time in Market vs Timing the Market
The fundamental difference between SIP and Lumpsum comes down to one thing:
- SIP: Time in market — you invest consistently, no matter what the market does.
- Lumpsum: Timing the market — you invest all at once and hope the entry point is right.
Most retail investors cannot predict market movements. That is why SIP is recommended for salaried individuals — it removes the pressure of timing. Lumpsum suits those who receive a large amount suddenly (bonus, inheritance, property sale) and want to deploy it immediately.
SIP vs Lumpsum: 5 Year Return Comparison
Assumption: Monthly SIP = ₹10,000 | Lumpsum = ₹6,00,000 (equivalent total). Returns calculated at 10%, 12% and 15% annual rate.
| Return Rate | SIP Total Invested | SIP Corpus (5 Yr) | Lumpsum Invested | Lumpsum Corpus (5 Yr) | Winner |
| 10% p.a. | ₹6,00,000 | ₹7,74,436 | ₹6,00,000 | ₹9,65,610 | Lumpsum 🏆 |
| 12% p.a. | ₹6,00,000 | ₹8,16,697 | ₹6,00,000 | ₹10,57,529 | Lumpsum 🏆 |
| 15% p.a. | ₹6,00,000 | ₹8,90,965 | ₹6,00,000 | ₹12,06,795 | Lumpsum 🏆 |
| Market Crash | ₹6,00,000 | ₹7,10,000* | ₹6,00,000 | ₹5,20,000* | SIP 🏆 |
*Approximate values in a market crash scenario (e.g., investing lumpsum just before a 30% correction).
| Key Insight: Over 5 years, lumpsum wins in a rising market because the full corpus earns returns from Day 1. But in a volatile or falling market, SIP wins because your average cost is lower. |
SIP vs Lumpsum: 10 Year Return Comparison
Assumption: Monthly SIP = ₹10,000 | Lumpsum = ₹12,00,000. Time horizon = 10 years.
| Return Rate | SIP Total Invested | SIP Corpus (10 Yr) | Lumpsum Invested | Lumpsum Corpus (10 Yr) | Winner |
| 10% p.a. | ₹12,00,000 | ₹20,48,450 | ₹12,00,000 | ₹31,12,553 | Lumpsum 🏆 |
| 12% p.a. | ₹12,00,000 | ₹23,23,391 | ₹12,00,000 | ₹37,27,452 | Lumpsum 🏆 |
| 15% p.a. | ₹12,00,000 | ₹27,86,573 | ₹12,00,000 | ₹48,54,552 | Lumpsum 🏆 |
| Volatile Mkt | ₹12,00,000 | ₹21,50,000* | ₹12,00,000 | ₹19,80,000* | SIP 🏆 |
*Volatile market scenario where multiple corrections occur over 10 years.
Use our SIP Calculator and Lumpsum Calculator to run your own numbers with your exact monthly amount and time horizon.
SIP vs Lumpsum: 15 Year Return Comparison
Assumption: Monthly SIP = ₹10,000 | Lumpsum = ₹18,00,000. Time horizon = 15 years.
| Return Rate | SIP Total Invested | SIP Corpus (15 Yr) | Lumpsum Invested | Lumpsum Corpus (15 Yr) | Winner |
| 10% p.a. | ₹18,00,000 | ₹41,79,392 | ₹18,00,000 | ₹75,21,861 | Lumpsum 🏆 |
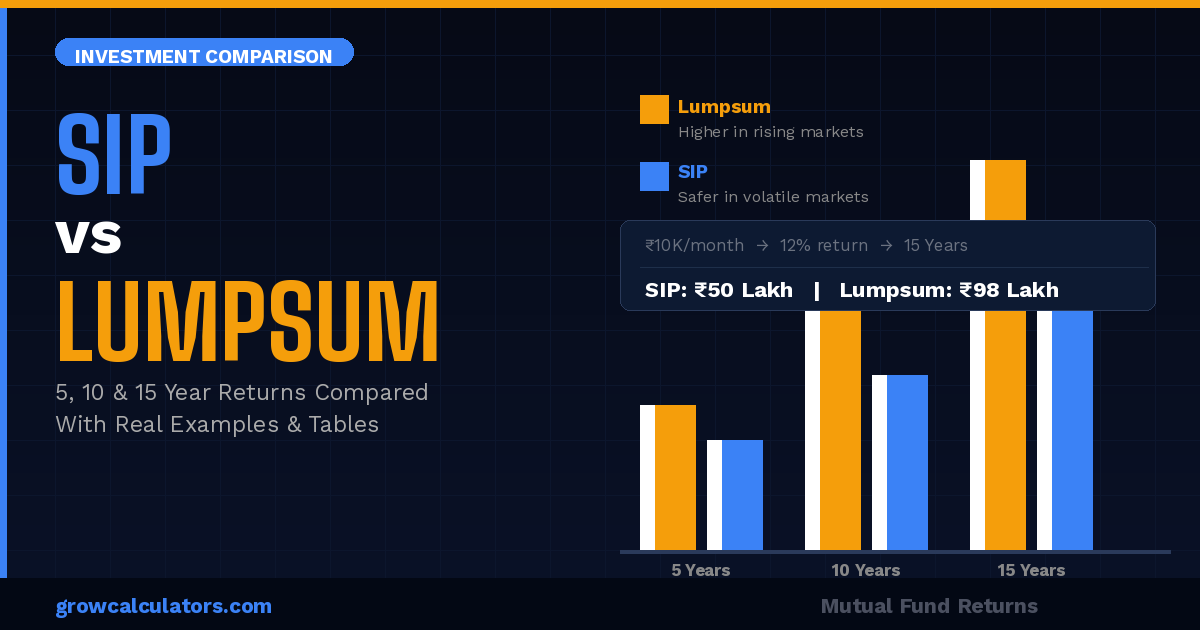
| 12% p.a. | ₹18,00,000 | ₹50,04,574 | ₹18,00,000 | ₹98,88,736 | Lumpsum 🏆 |
| 15% p.a. | ₹18,00,000 | ₹67,68,628 | ₹18,00,000 | ₹1,43,63,278 | Lumpsum 🏆 |
| Real Market* | ₹18,00,000 | ₹55,00,000* | ₹18,00,000 | ₹52,00,000* | SIP 🏆 |
*Real market scenario includes 2–3 major corrections over 15 years (as historically observed in Nifty 50).
| Important: Lumpsum looks better on paper because we assume a fixed return rate. In reality, markets go up and down. When corrections are factored in, SIP often delivers competitive or better results over long periods — because you keep buying at lower prices during corrections. |
SIP vs Lumpsum: Full Head-to-Head Comparison
| Feature | SIP | Lumpsum |
| Investment Style | Monthly fixed amount | One-time full amount |
| Best Market Condition | Volatile or falling markets | Bull market or market bottom |
| Rupee Cost Averaging | ✅ Yes — built-in | ❌ No — single price |
| Discipline Required | High — must invest every month | Low — invest once |
| Suitable For | Salaried investors | Investors with surplus cash |
| Risk | Lower — spread over time | Higher — depends on entry point |
| Returns (Rising Mkt) | Moderate | Higher |
| Returns (Falling Mkt) | Better | Lower |
| Flexibility | Start/stop anytime | Commit full amount upfront |
| Minimum Amount | ₹500/month | ₹1,000 (varies by fund) |
The Smart Middle Ground: STP (Systematic Transfer Plan)
If you have a large lumpsum but are nervous about investing at market highs, STP is your best friend.
How it works: Invest your lumpsum in a liquid or debt fund first. Then set up an automatic monthly transfer (STP) to your equity fund. You get the safety of debt + the rupee cost averaging of SIP.
| Example: You have ₹10 lakh. Park it in a liquid fund earning ~6.5% p.a. Set up STP of ₹50,000/month to a Nifty 50 fund. Your idle money earns returns while you systematically move into equity over 20 months. |
Who Should Choose SIP and Who Should Choose Lumpsum?
| Your Situation | Recommended Approach |
| Salaried, investing monthly savings | SIP — invest every month from salary |
| Received annual bonus or variable pay | STP — park in liquid fund, transfer monthly to equity |
| Markets just fell 20–30% from peak | Lumpsum — best time to deploy large amount |
| Markets at all-time highs | SIP or STP — avoid lumpsum at peaks |
| Long horizon (15+ years), any market | Either works — time in market beats timing |
| Short horizon (less than 3 years) | Avoid equity SIP/Lumpsum — use FD or debt funds |
| First time investor, unsure of market | SIP — builds discipline and reduces anxiety |
Real-Life Example: Ramesh vs Suresh
Let us look at two investors who both have ₹12 lakh to invest over 10 years in a fund that gives 12% annual return:
| Ramesh (Lumpsum) | Suresh (SIP) | |
| Investment | ₹12,00,000 on Day 1 | ₹10,000/month for 10 years |
| Total Invested | ₹12,00,000 | ₹12,00,000 |
| Corpus After 10 Years | ₹37,27,452 | ₹23,23,391 |
| Profit Earned | ₹25,27,452 | ₹11,23,391 |
| Advantage | Higher returns in ideal conditions | Lower risk, more affordable monthly |
| Risk Factor | High — entered at one price | Low — spread across 120 months |
Ramesh earns more — but only because we assumed a steady 12% return with no market crash. In reality, if Ramesh invested in January 2008 (just before the crash), his ₹12 lakh would have fallen to ₹6 lakh by March 2009. Suresh’s SIP would have kept buying cheaper units throughout the crash and recovered faster.
Conclusion: SIP or Lumpsum — Which is Right for You?
There is no universal winner. Both strategies have their place:
- SIP wins when markets are volatile, you are salaried, or you are a first-time investor.
- Lumpsum wins when markets have corrected significantly, you have a long horizon, and you have the risk appetite for a one-time commitment.
- STP wins when you have a large amount but want the safety of gradual deployment into equity.
Calculate your exact returns using our SIP Calculator and Lumpsum Calculator. For step-up SIP where you increase your monthly investment each year, try our Step-up SIP Calculator. And if you are planning lumpsum returns over multiple years, our CAGR Calculator and XIRR Calculator will help you measure actual performance.
— Published on GrowCalculators.com | Investment Comparison Guides